
San Bernardino, Muscoy Community Air Quality Report
San Bernardino, Muscoy Community Air Quality Report
Area Overview
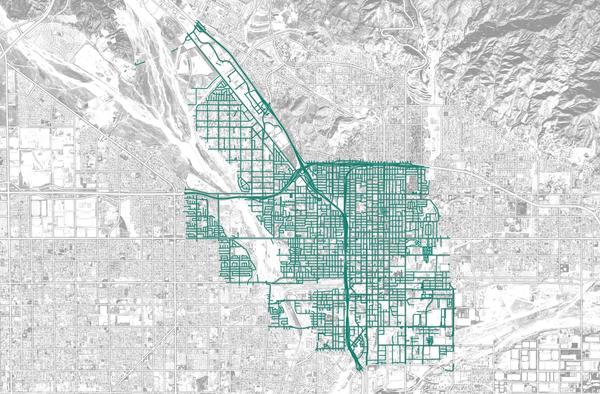
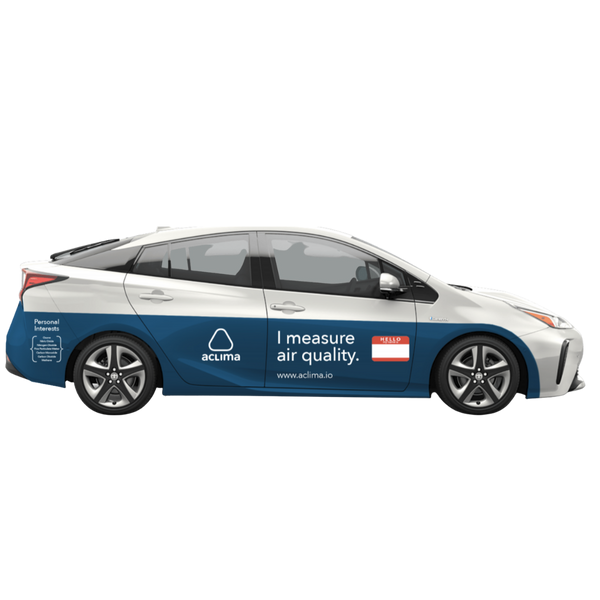
Aclima uncovered where air pollution is the worst across more than 7,600 blocks
Aclima uncovered where air pollution is the worst across more than 7,600 blocks


Sensitive Sites: air quality trends where sensitive populations spend time
Sensitive Sites: air quality trends where sensitive populations spend time
Not all people are impacted by air pollution the same way. Some people, such as children, older members of the community, those with chronic medical conditions, and others who are more sensitive to certain pollutants and may experience negative health effects from smaller increases in air pollution – even if levels are below regulatory thresholds. We studied schools, healthcare facilities, early learning and childcare sites, parks, libraries, community centers, and public housing projects to learn about their typical air quality and potential exposure.
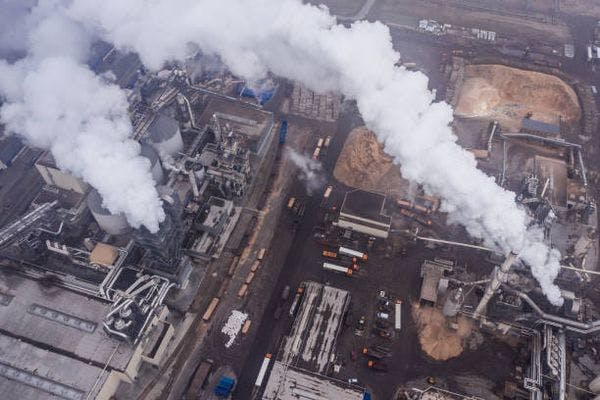
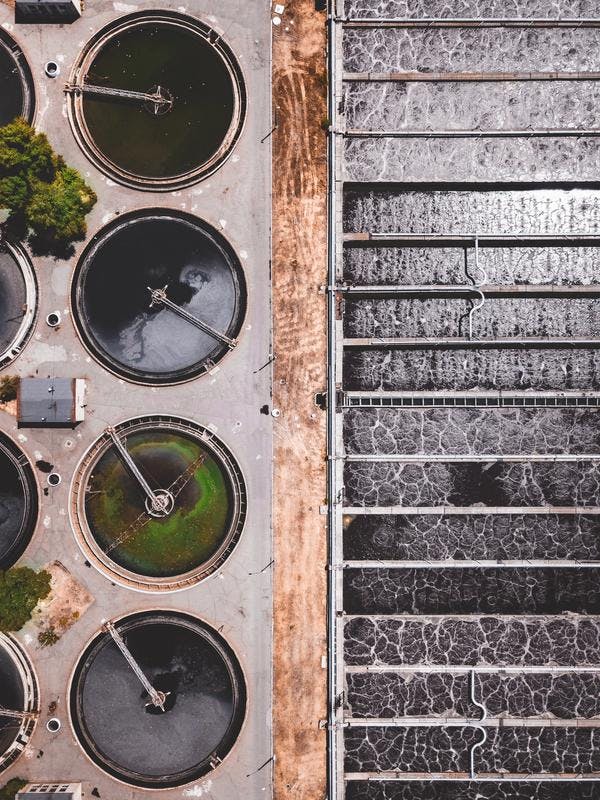
Stationary Sources: where is it all coming from? A look at emissions from known stationary sources
Stationary Sources: where is it all coming from? A look at emissions from known stationary sources
There are thousands of regulated facilities in the Greater Los Angeles Area – facilities that need to self-report their emissions to ensure compliance with the Clean Air Act. What did we typically find in the air near these locations? What sensitive populations are nearby? Here you can explore metal processing, auto body shops, rendering, warehouses, railyards, usyards and nearby air quality.
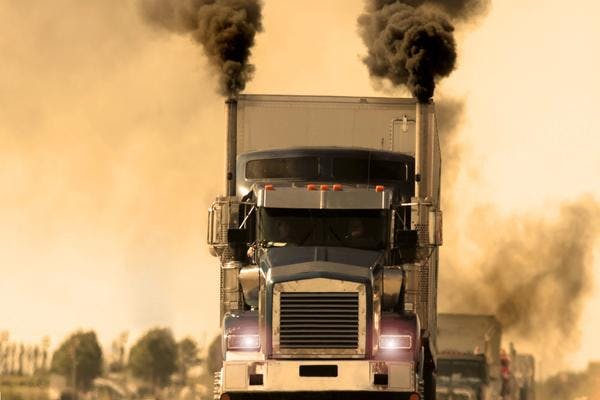
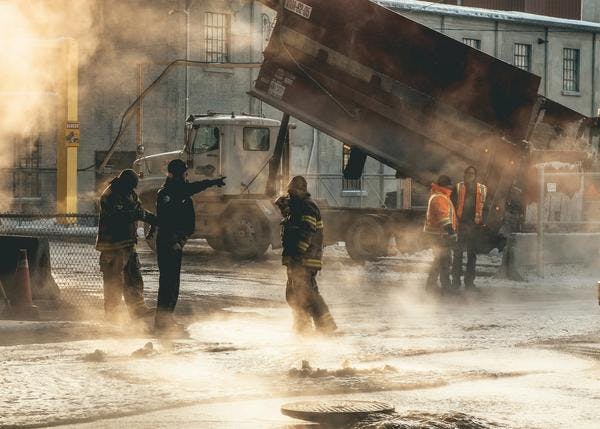
Diesel Pollution Indicator: Overview
Diesel Pollution Indicator: Overview
Diesel emissions are harmful to human health and considered an air toxic, a category of pollutants linked to lung cancer, and respiratory and heart problems. At the hyperlocal level, we identify areas where elevated diesel emissions may affect human and environmental health.
Methane Indicator: overview
Methane Indicator: overview
Areas in the community with elevated ambient methane concentrations (above the typical background level) are shown here. The indicator reveals methane from multiple sources, for example: natural gas lines, landfills, livestock, and sewage. A potent greenhouse gas, methane has significant impacts on global climate change, and can pose local safety risks when associated with natural gas distribution leaks.See areas in the community with elevated ambient methane concentrations, above the typical background level. The indicator reveals methane from multiple sources, for example: natural gas lines, landfills, livestock, and sewage. A potent greenhouse gas, methane has significant impacts on global climate change, and can pose local safety risks when associated with natural gas distribution leaks.
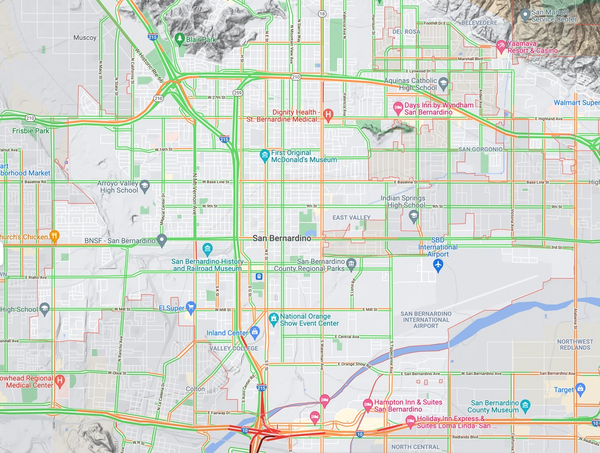
Traffic Pollution Indicator: overview
Traffic Pollution Indicator: overview
Traffic emissions include a range of unhealthy pollutants that Aclima measures, including black carbon and criteria pollutants like carbon monoxide, nitrogen dioxide, and fine particulate matter. Although these emissions most adversely affect the health of young children, older residents, and those with preexisting conditions, they pose health risks for all people. In this report, we identify areas of high vehicle emissions that are most likely to impact communities and sensitive sites such as schools, childcare centers, and health care facilities.
Particulate Matter Indicator: overview
Particulate Matter Indicator: overview
The PM Indicator enables air regulators, community members, researchers, and health professionals to see hyperlocal variations in typical concentrations of PM2.5. Inhaling microscopic fine particulate matter has been known to increase the likelihood of negative health effects ranging from respiratory and cardiovascular problems to an increased risk of developing cancer, reproductive and developmental issues, and reduced life expectancy.
More to come!
More to come!
Aclima is currently completing analysis and visualizations for additional stories that will be posted here. Check back soon!
Address Lookup
See an air quality report for any address within San Bernardino and Muscoy.